Students
Analytics
Workspace and course analytics (revenue, students, watch time, completion and where viewers stop), CSV exports, and the weekly summary email.
Analytics shows how your courses are doing: what you've earned, how many students joined, how much they watch, how far they get, and where they stop. There's a workspace view across all courses and a deeper view for each course. Owners and editors can see both.
Date ranges
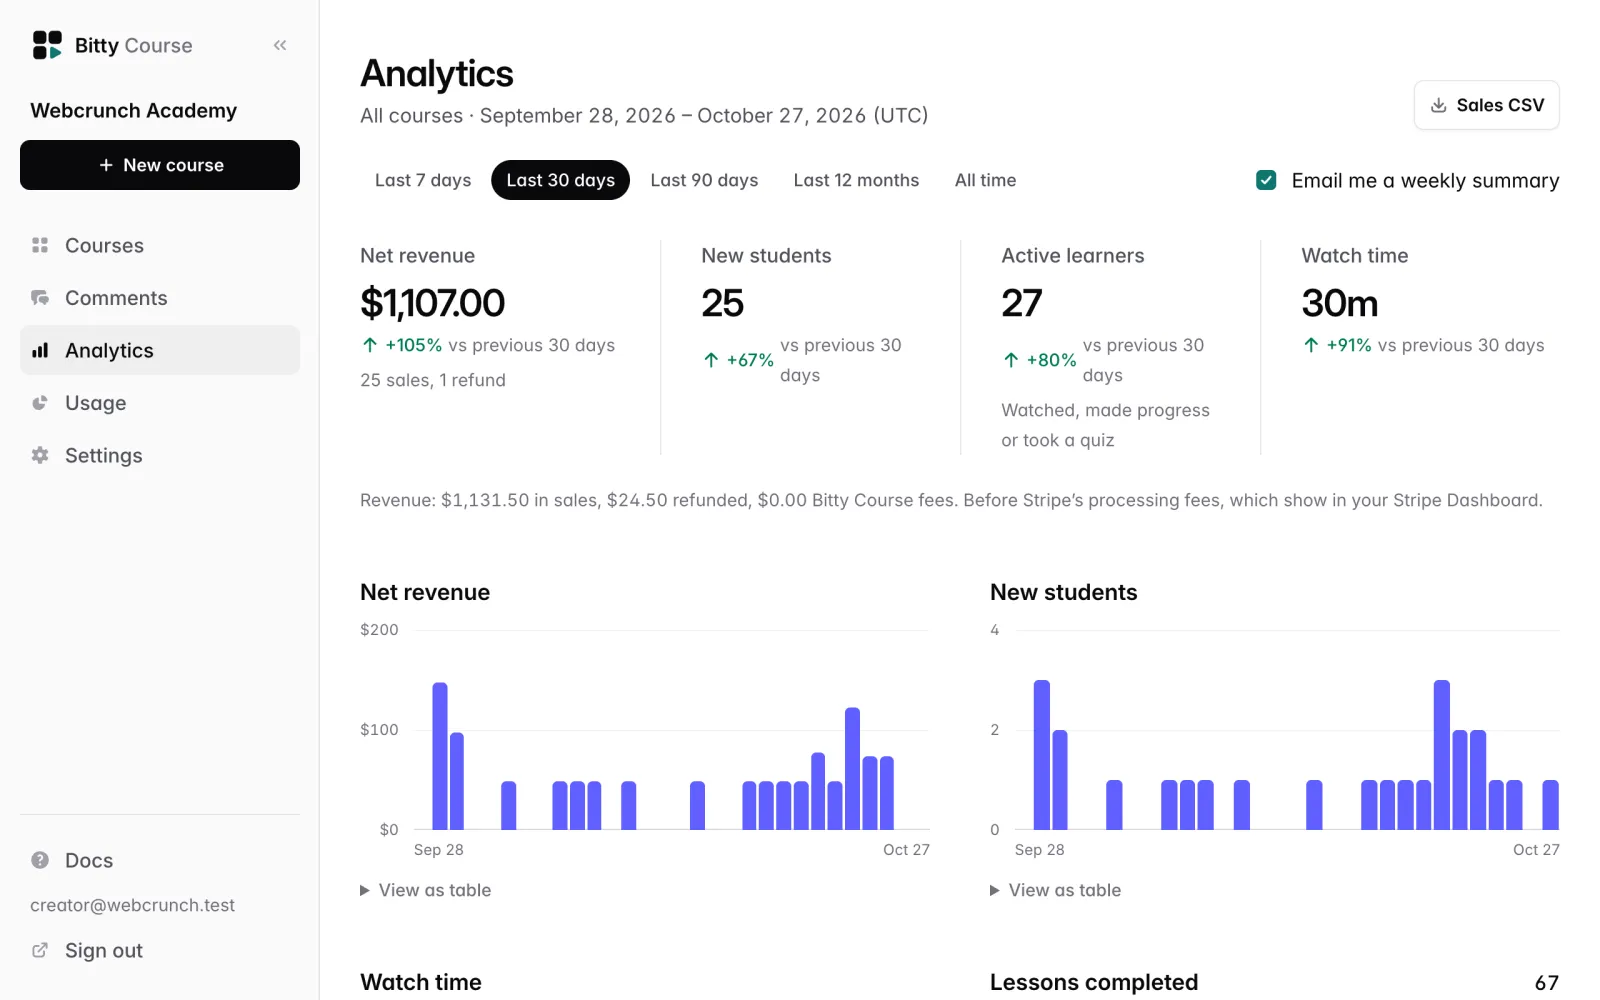
Both views have the same range buttons: Last 7 days, Last 30 days (the default), Last 90 days, Last 12 months and All time. All time starts on the day the workspace (or course) was created.
- All dates are UTC days. The page shows the exact range, for example "September 27, 2026 – October 26, 2026 (UTC)".
- Headline numbers compare against the equally long period just before, for example "+12% vs previous 30 days". There's no comparison for All time.
- Charts group by day for ranges up to 31 days, by week up to 120 days, and by month beyond that.
Workspace analytics
Click Analytics in the studio sidebar.
Headline numbers
| Number | What it counts |
|---|---|
| Net revenue | Sales minus refunds and Bitty Course fees in the range, with the number of sales and refunds |
| New students | People who first got access to a course in the range |
| Active learners | Students who watched, saved progress or took a quiz in the range |
| Watch time | Video your students actually played, in hours and minutes |
A line under the numbers breaks revenue down: sales, refunded, and Bitty Course fees. All amounts are before Stripe's processing fees, which you see in your Stripe Dashboard.
If your courses sell in more than one currency, the headline uses the currency most of your courses use, and the line below adds the others, for example "Also EUR 120.00 net in EUR (3 sales)."
Charts
Net revenue, New students, Watch time and Lessons completed over the range.
Courses table
One row per course: Students (with access today), New (in the range), Net revenue (in the range; "Free" for courses that aren't paid), Average progress and Finished (share of students with access who completed every lesson). Students and progress are as of today. Click a course title to open its analytics.
Course analytics
Open a course and click its Analytics tab, or click a course in the workspace Courses table. All courses goes back.
Headline numbers
- Net revenue for a paid course ("before Stripe fees"), or Course page views for a free or invite-only course
- New students, with how many have access now
- Active learners
- Watch time
Plus charts of New students and Watch time.
From visitor to student
Bars for Course page views, Checkouts started (paid courses only), and Purchased (paid) or Joined (free and invite-only), all in the range. Above the bars, the share of page views that became a student. If page views only started being counted partway through the range, it says "Page views counted since" that date.
Course page views leave out search engines and other bots, link prefetches, and anyone on your team. No IP addresses or third-party trackers are used.
Where students are
Everyone with access today, grouped by share of lessons completed: Not started, Under halfway, Halfway or more and Completed.
Lessons
One row per lesson, grouped by section:
| Column | What it shows |
|---|---|
| Started | Students with access who have any progress on the lesson (as of today) |
| Completed | Share of students with access who completed it (as of today) |
| Watch time | Video played on this lesson in the range (video lessons only) |
| Viewers still watching | See below |
Viewers still watching is a small line across the length of the lesson's current video. It shows the share of viewers who watched each part, start to end. Hover over the line for the exact share at each point. Next to it is the number of viewers and, when at least 10% of viewers leave at one point, "drop at" that time. A steep fall marks where people stop watching. This covers all viewing of the current video, not only the selected range. A lesson with no views yet says "No views yet", and a lesson without video says "Text lesson".
For quiz lessons, the row shows the share of attempts that passed, the average score and the number of attempts in the range. Under it, Most missed lists up to three questions most often answered wrong, with the share wrong. Most missed counts every attempt on the current quiz version, whatever the range.
How the numbers are counted
- Days are UTC. Students count once per course, from the day they first got access.
- Watch time is video your students actually played, reported by the lesson player. Skipping ahead doesn't count as watching. It's separate from the viewing on your Usage page, which counts everything the video service delivered and is what your plan's viewing allowance measures. See Plans and usage.
- Revenue comes from your Bitty Course orders, minus refunds and Bitty Course fees. Stripe's processing fees aren't included.
- Completion uses every lesson in the course, including quizzes and text lessons.
These notes are also at the bottom of both analytics pages, under How these numbers are counted.
Export to CSV
Sales
Only owners can download CSVs, because they list students’ email addresses. On the workspace Analytics page, click Sales CSV. You get every order paid or refunded in the selected range, across all courses. The file is named like sales-2026-09-27-to-2026-10-26.csv.
Columns: Paid (UTC), Course, Student (email), Amount, List price, Discount (coupon code or sale name), Currency, Bitty Course fee, Status, Refunded (UTC), Payment provider, Payment id.
Students
On a course's Students tab, click Export CSV. See Students for the columns.
In both files, cells that start with =, +, - or @ get a leading ' so spreadsheet apps treat them as text.
The weekly summary email
Every owner and editor gets a summary email on Mondays, with numbers for the 7 full days before (UTC). It's on by default. It includes:
- Net revenue, New students, Active learners, Watch time and Lessons completed
- up to five courses, busiest first, with new students, revenue for paid courses, and how many students have been inactive for 30+ days
- a link to your analytics
It's only sent when there's something to report: a published course with students, new students, or sales that week. Summaries stop when a canceled workspace's 30-day grace period ends. Each person gets at most one summary per workspace a week.
Turn it off or on
The setting is per person and per workspace. Turning it off doesn't affect teammates.
- On the workspace Analytics page, untick Email me a weekly summary (tick it to turn it back on). It saves straight away.
- Or click Stop weekly summaries at the bottom of the email, then the Stop weekly summaries button on the page that opens. You don't need to sign in. Mail apps that offer a one-click unsubscribe use the same link.
Other emails, like usage warnings, still arrive.
Analytics from your assistant or the command line
The same numbers are available to an AI assistant through the get_workspace_stats and get_course_stats tools, and from the CLI. They don't include student names or emails. See MCP server.
Your own analytics tools
To measure visits with your own tools, add a Google Analytics 4 measurement ID or a Meta Pixel ID in Settings → Course site → Analytics (owners only). The tags load on your course site's home page and course pages only. Lesson pages, the player and checkout are never tracked.
Good to know
- Editors see revenue too. There is no role that hides it.
- Analytics pages never name individual students. To look at one student, use the course's Students tab.